Investment
Stewardship and responsible investment
Collectively the £291bn LGPS funds are one of the largest 10 global sources of capital and can influence behavioural changes that lead to better stewardship by the global asset management community and the entities and places they invest in.
All LGPS funds have published their Investment Strategy Statement (replacing Statement of Investment Principles) and comply with the Myners Principles as these are LGPS statutory requirements.
The UK Stewardship Code (second edition 2012) and global United Nations Principles of Responsible Investment (UNPRI) set out key principles of effective stewardship for asset owners to help them better to exercise their stewardship responsibilities.
Compliance with these UK and global sets of principles is not mandatory for LGPS funds but they have the support of the UK Government and Local Authority Pension Fund Forum (LAPFF).
Some 32 LGPS funds/pools (36%) were Tier 1 signatories to the Code and 12 funds (13%) (inc five pool companies) were signatories to the UNPRI (see table below). Since March 2019, one more pool company and Hampshire Pension Fund became signatories to UNPRI
Signatory to UNPRI
Source: https://www.unpri.org/directory/
| Account Name | Signatory Category | HQ Country | Signature Date |
|---|---|---|---|
| Hampshire Pension Fund | Asset Owner | United Kingdom | 16/01/2020 |
| Border to Coast Pensions Partnership Limited | Asset Owner | United Kingdom | 31/10/2019 |
| City of London Corporation | Asset Owner | United Kingdom | 12/12/2018 |
| Local Pensions Partnership | Asset Owner | United Kingdom | 20/07/2018 |
| LGPS Central | Asset Owner | United Kingdom | 24/05/2018 |
| London CIV | Asset Owner | United Kingdom | 21/05/2018 |
| Brunel Pension Partnership (BPP) | Asset Owner | United Kingdom | 16/03/2018 |
| Kent County Council Superannuation Fund | Asset Owner | United Kingdom | 11/04/2016 |
| Lancashire County Pension Fund | Asset Owner | United Kingdom | 10/03/2015 |
| Greater Manchester Pension Fund | Asset Owner | United Kingdom | 06/05/2014 |
| West Midlands Pension Fund | Asset Owner | United Kingdom | 28/06/2011 |
| Merseyside Pension Fund | Asset Owner | United Kingdom | 10/10/2007 |
| London Pensions Fund Authority (LPFA) | Asset Owner | United Kingdom | 16/07/2007 |
| Environment Agency Pension Fund | Asset Owner | United Kingdom | 14/07/2006 |
Signatories to UK Stewardship Code
Tier 1
Signatories provide a good quality and transparent description of their approach to stewardship and explanations of an alternative approach where necessary.
Avon Pension Fund (PDF)
Bedfordshire Pension Fund (PDF)
Border to Coast Pension Partnership
City of London Corporation
Clwyd Pension Fund (PDF)
Cumbria Local Government Pension Scheme
Derbyshire County Council Pension Fund
Devon Pension Fund
East Riding Pension Fund (PDF)
East Sussex Pension Fund
Environment Agency Active Pension Fund
Greater Manchester Pension Fund
Hampshire Pension Fund
Lancashire County Pension Fund (PDF)
LGPS Central Ltd (PDF)
Lincolnshire Pension Fund
Local Pensions Partnership
London Borough of Camden Pension Fund (PDF)
London Borough of Hackney Pension Fund (PDF)
London Borough of Haringey Pension Fund (PDF)
London CIV
London Pensions Fund Authority (PDF)
North Yorkshire Pension Fund
Shropshire County Pension Fund
Staffordshire Pension Fund
South Yorkshire Pensions Authority
The Tyne and Wear Pension Fund
Warwickshire County Council Pension Fund (PDF)
West Midlands Pension Fund
West Yorkshire Pension Fund
Wiltshire Pension Fund
Worcestershire County Council Pension Fund
Tier 2
Signatories meet many of the reporting expectations but report less transparently on their approach to stewardship or do not provide explanations where they depart from provisions of the Code.
Gwynedd Pension Fund
London Borough of Bexley Pension Fund
London Borough of Ealing Pension Fund
London Borough of Hillingdon Pension Fund
London Borough of Waltham Forest Pension Fund
Merseyside Pension Fund
Rhondda Cynon Taff Pension Fund
Somerset County Council
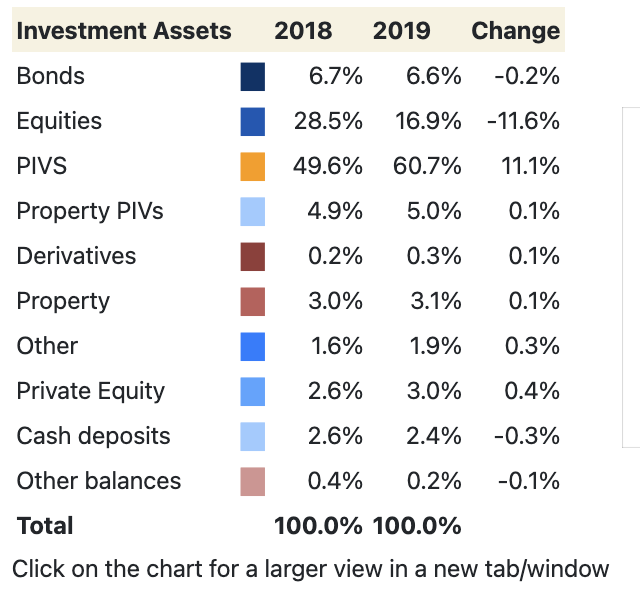
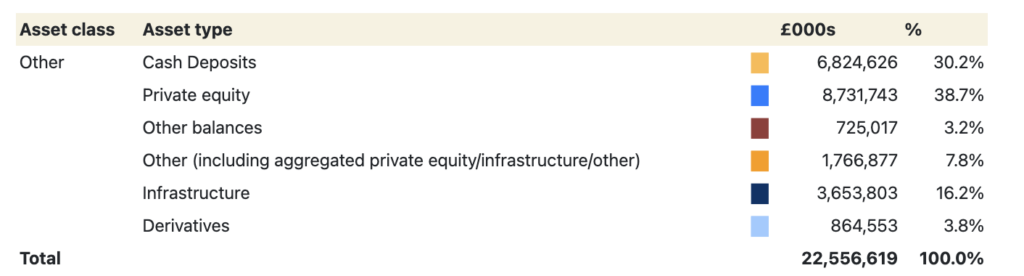
Investment allocation
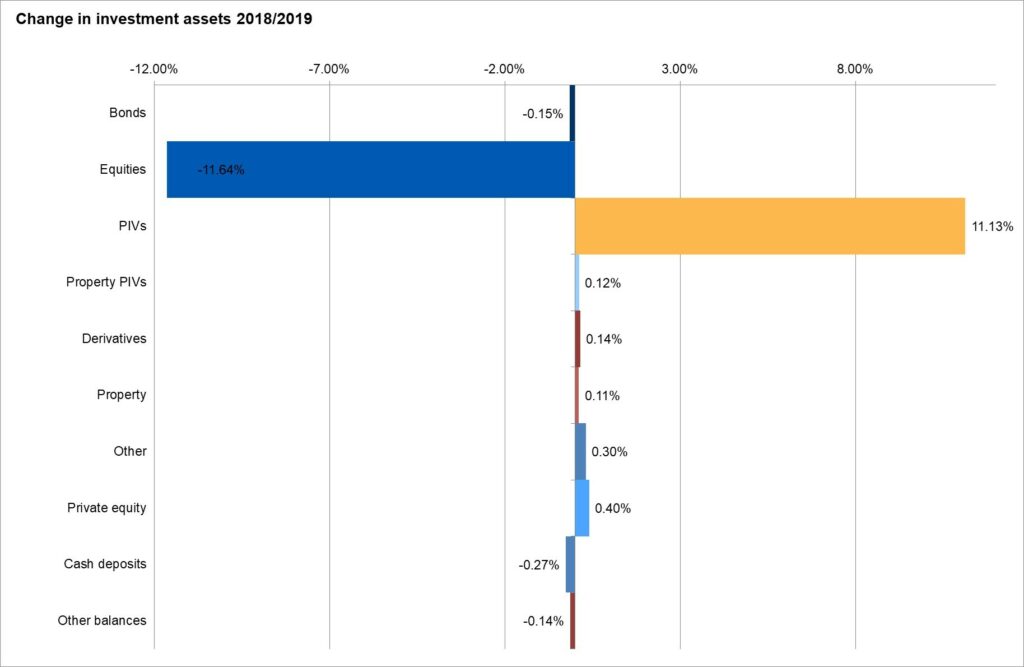
Change in allocation chart based on aggregated Net Asset Statements year to 31 March 2019
Click on the chart for a larger view in a new tab/window
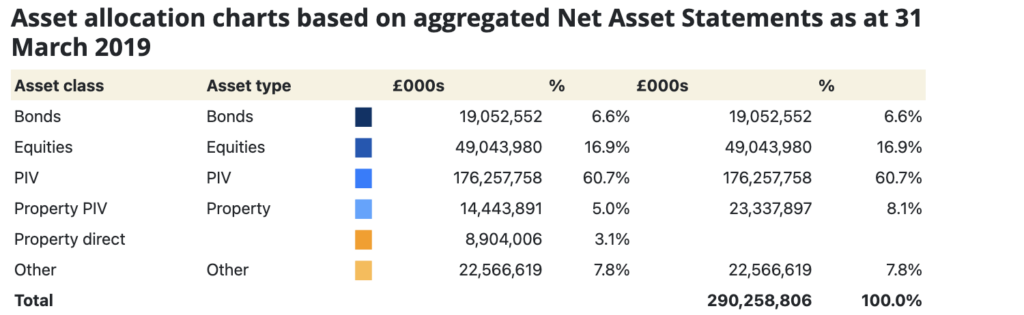
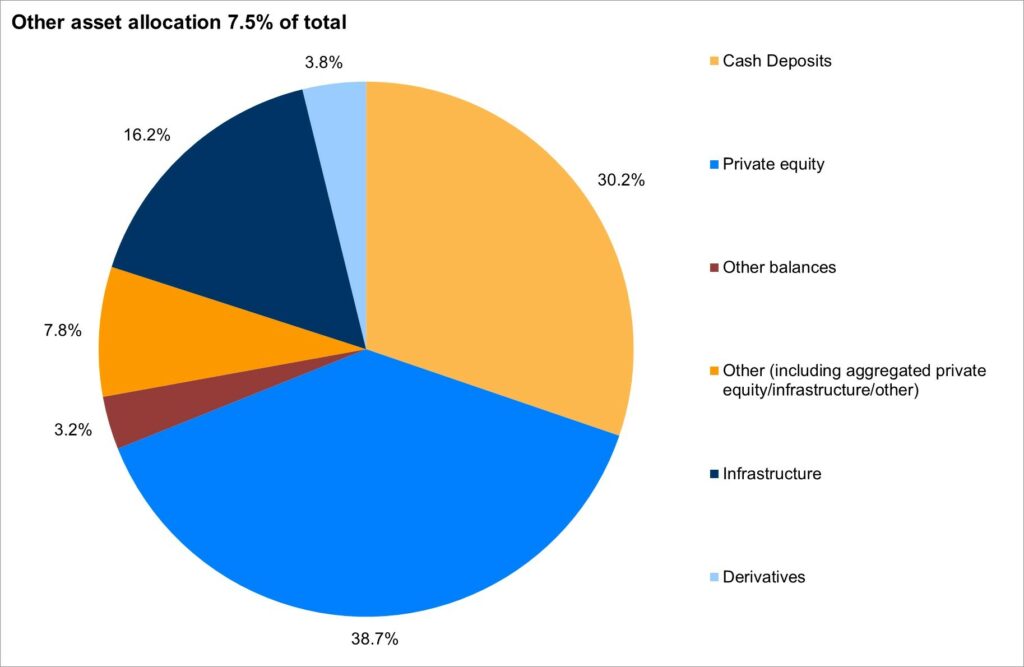
Asset allocation charts based on aggregated Net Asset Statements as at 31 March 2019
Net return on investment based on aggregated Fund accounts year to 31 March 2019
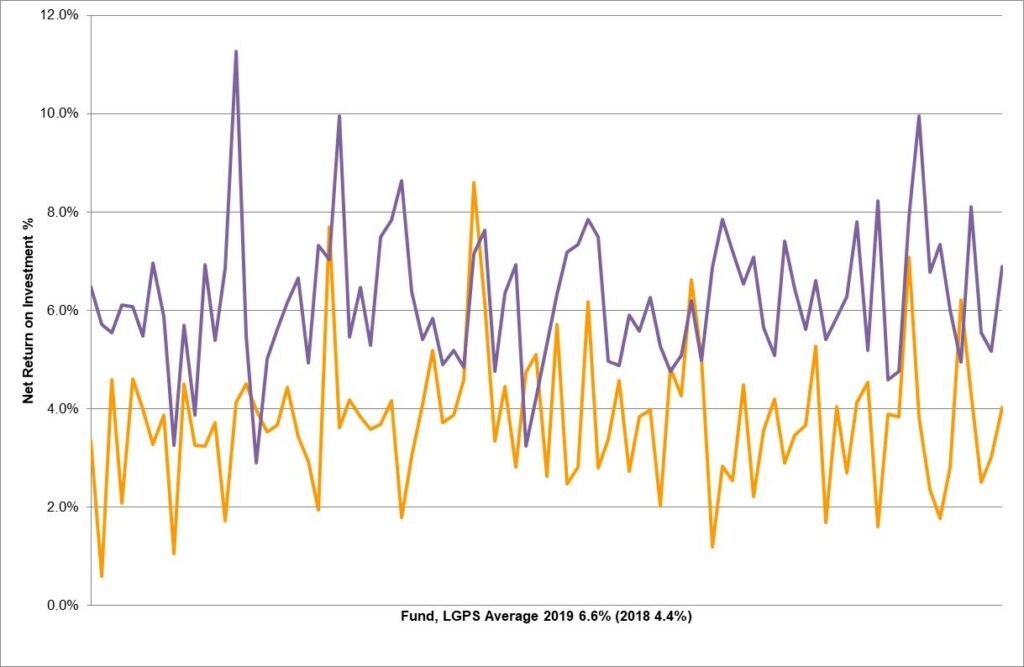
Net return on investment % is calculated by dividing the net return on investment by the average value of the fund over the year – this differs from calculated performance.
The average return on investment, and total for the scheme on an aggregate basis, for the year ended 31 March 2019 was 6.6% (2018 4.4%). The average investment expenses were 0.4% over the period (2018 0.4%), therefore the net return on investment was 6.2% (2017 4.0%).
The above chart shows the distribution around 6.0%, for 2019 █, with most funds falling in a range of between 4.0% and 8.0%. For 2018 █ the distribution was around 4.0%, with most funds falling in a range of between 2.0% and 6.0%.
Investment Performance
The following market commentary was provided by Pensions & Investment Research Consultants Ltd (PIRC) based on their Local Authority Pension Fund Performance Universe.
This year’s peer group results is based on a Universe of 64 funds with a value of £193bn. This represents some two thirds of local authority pension fund assets and includes all of the Welsh and Northern Pools, all bar one of the London Pool, with funds from all other pools except Central.
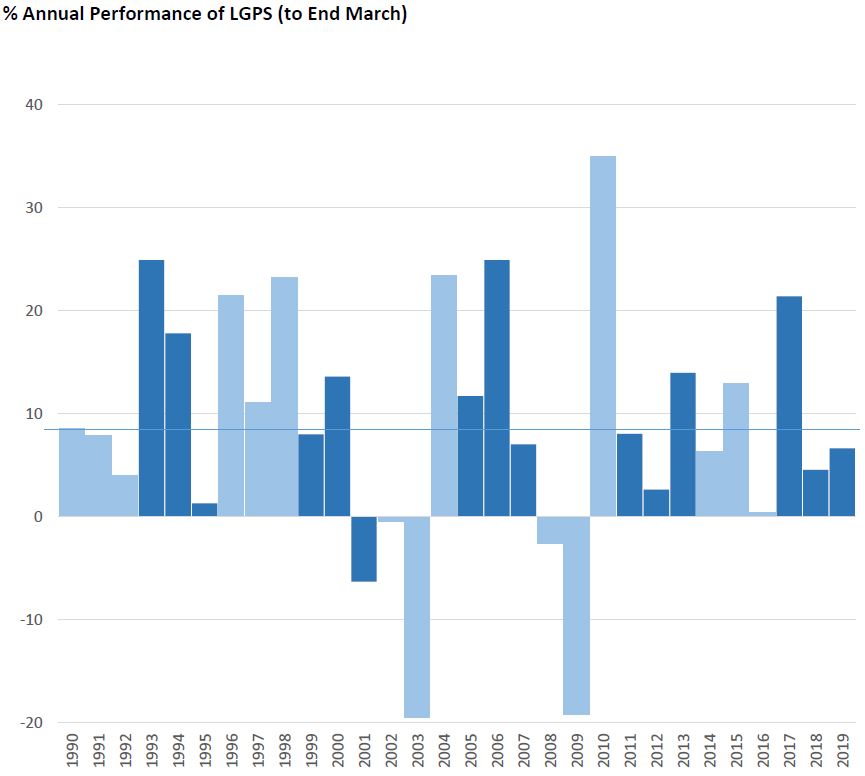
LA Market Environment
There were many headwinds facing investors over the last year. Unease over historically high levels of markets, political uncertainty, the escalating trade war between the US and China and the ongoing unresolved issues around how, or even if, the UK would leave Europe all impacted sentiment and made for a volatile year. Despite this, over the fiscal year the average Local Authority pension fund returned a very respectable 6.6%. While this return is below the 30 year average (blue line in the chart below) of 8.4% p.a. it is well ahead of inflation and of actuarial assumptions which are currently around 4% p.a.
The latest year did not see a continuation of the dramatic reduction in equity exposure that had been in evidence in 2017/18 and high level asset allocation remained unchanged over the year as can be seen below.
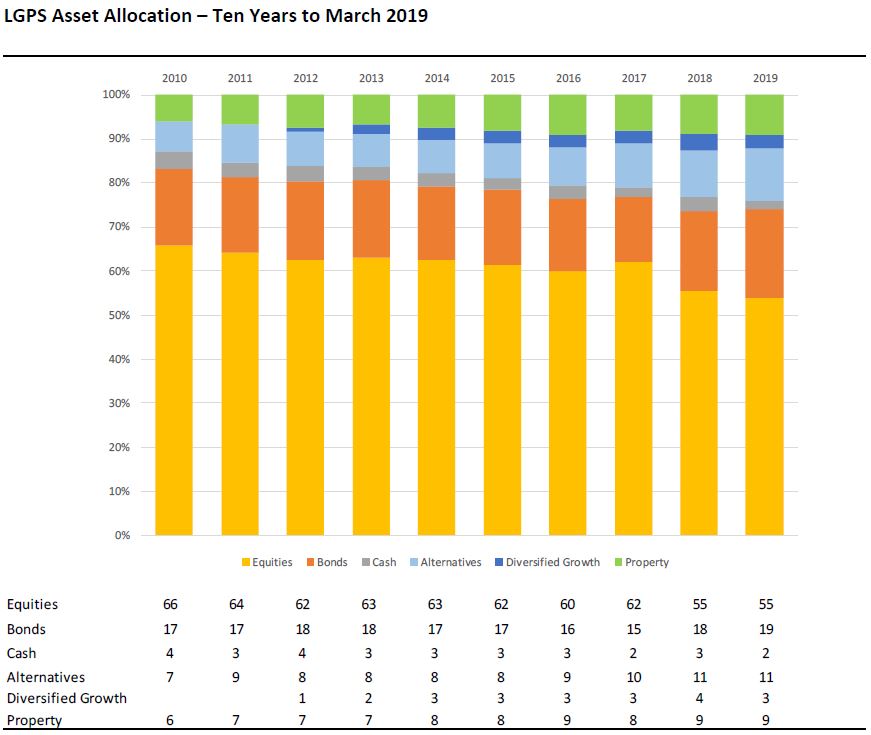
There were however a number of changes beneath that which took place during the year. These included a move into ‘green’ investments across a range of funds, a continued investment into enhanced index / smart beta investments including low volatility and an increase in the level of passive equity investment. Bond investment became more diverse as funds invested into multi-asset credit, private debt and secured property income funds. The move into pooled assets began in a significant way which meant fund manager changes were well up on average. Interestingly fund complexity continued to increase.
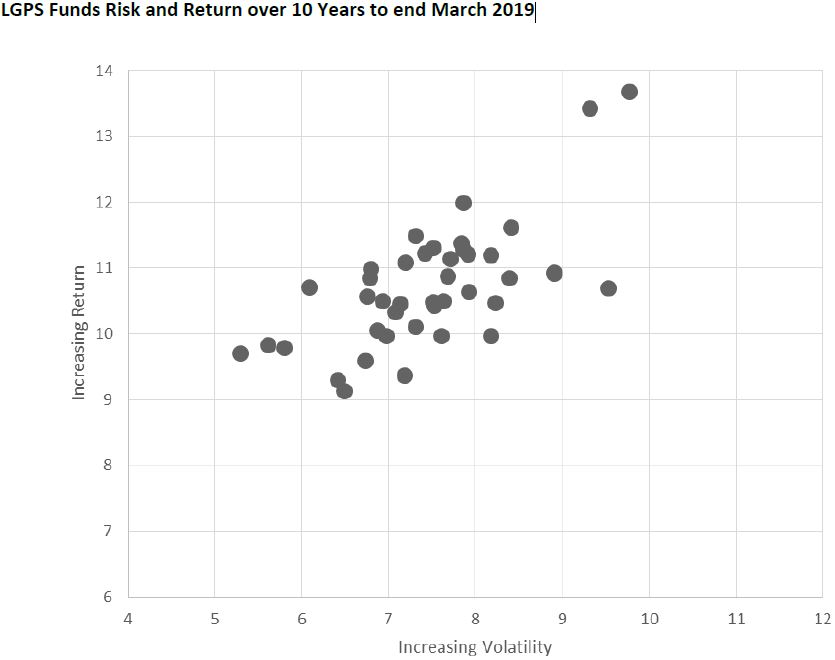
Over the last ten years the average fund returned 10.8% p.a.. As can be seen below there was a large difference between the return generated by the funds that accepted the highest level of volatility and the funds that had structures their assets to reduce this aspect of risk. The most volatile fund achieved a return 41% better over the period than the least volatile.
Report pages
Was this page helpful?