Investment
Asset management and stewardship
Stewardship and responsible investment
Collectively the £217bn LGPS funds are one of the largest 10 global sources of capital and can influence behavioural changes that lead to better stewardship by the global asset management community and the entities and places they invest in.
All LGPS funds have published their Statement of Investment Principles and comply with the Myners Principles as these are LGPS statutory requirements.
The UK Stewardship Code (second edition 2012) and global United Nations Principles of Responsible Investment (UNPRI) set out key principles of effective stewardship for asset owners to help them better to exercise their stewardship responsibilities.
Compliance with these UK and global sets of principles is not mandatory for LGPS funds but they have the support of the UK Government and Local Authority Pension Fund Forum (LAPFF).
As at 31st March 2015 some 18 (20%) were signatories to the Code and funds (8%) signatories to the UNPRI (see table below).
Five LGPS funds were named and ranked in the top 500 of the worlds institutional investors for taking account of climate change risk in their investments in the 2016 annual survey by the global ‘Asset Owners Disclosure Project’. They were Environment Agency 1st, Greater Manchester 30th, Norfolk 66th, West Midlands 75th, West Yorkshire 95th.
| Signatory to UK Stewardship Code | Signatory to UNPRI | |
| Avon (BANES) | yes | |
| Bedfordshire | yes | |
| East Riding | yes | |
| Environment Agency | yes | yes |
| Greater Manchester | yes | yes |
| Gywnedd | yes | |
| Lancashire | yes | yes |
| Lincolnshire | yes | |
| LB Bexley | yes | |
| LB Ealing | yes | |
| LB Haringey | yes | |
| LB Hillingdon | yes | |
| London Pension Fund Authority | yes | yes |
| Merseyside | yes | yes |
| Somerset | yes | |
| Tyne and Wear | yes | |
| Warwickshire | yes | |
| West Midlands | yes | yes |
| Wiltshire | yes |
Investment allocation
Change in allocation chart based on aggregated Net Asset Statements year to 31 March 2015
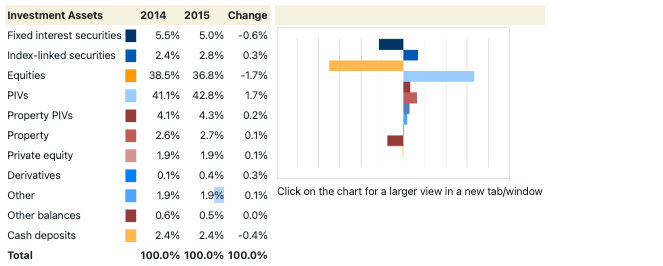
Asset allocation charts based on aggregated Net Asset Statements as at 31 March 2015
| Asset class | Asset type | £000s | % | £000s | % | |
|---|---|---|---|---|---|---|
| Fixed interest | Fixed interest UK | █ | 7,598145 | 3.5% | 10,754,484 | 5.0% |
| Fixed interest Overseas | █ | 3,156,339 | 1.5% | |||
| Index-linked | Index-linked UK (where stated) | █ | 5,086,161 | 2.3% | 5,958,578 | 2.8% |
| Index-linked Overseas | █ | 872,417 | 0.4% | |||
| Equities | Equities UK | █ | 33,773,339 | 15.6% | 79,660,156 | 36.8% |
| Equities Overseas | █ | 45,886,817 | 21.2% | |||
| PIVs | █ | 92,666,817 | 42.8% | 92,666,817 | 42.8% | |
| Property | Property PIVs | █ | 9,217,811 | 4.3% | 15,050,029 | 7.0% |
| Property (Direct investment) | █ | 5,832,218 | 2.7% | |||
| Other | █ | 12,418,763 | 5.7% | 12,418,763 | 5.7% | |
| Total | 191,332,268 | 100.0% |
Total asset allocation

Other asset allocation

| Asset class | Asset type | £000s | % | |
|---|---|---|---|---|
| Other | Cash Deposits | █ | 4,475,296 | 36.0% |
| Private equity | █ | 4,153,422 | 33.4% | |
| Other balances | █ | 1,145,286 | 9.2% | |
| Other (including aggregated private equity/infrastructure/other) | █ | 831,569 | 6.7% | |
| Infrastructure | █ | 950,691 | 7.7% | |
| Derivatives | █ | 862,499 | 6.9% | |
| Total | 12,418,763 | 100.0% |
Net return on investment based on aggregated Fund accounts year to 31 March 2015

Net return on investment % is calculated by dividing the net return on investment by the average value of the fund over the year – this differs from calculated performance.
The average net return on investment, and total for the scheme on a aggregate basis, for the year ended 31 March 2015 was 12.1% (2013 5.9%). The average investment expenses were 0.4% over the period (2014 0.3%), therefore the gross return on investment was 12.5% (2014 6.2%).
The above chart shows the distribution around 12.1%, for 2015 █, with most funds falling in a range of between 7.0% and 16.0%. For 2014 █ the distribution was around 5.9%, with most funds falling in a range of between 0.0% and 10.0%, and for 2013 █ 12.5%.
Investment Performance
The following report for 2015 has been provided by State Street Investment Analytics (SSIA).
LA Market Environment
The average local authority pension fund returned 13% in 2014/15.
Equity markets performed strongly but with marked differences across region. UK returned only 6% for the year with investors concerned about the possibility of political uncertainty that could result from a hung parliament after the upcoming general election. Japan was the strongest performing of the major overseas markets returning over 30% to local investors, but a slightly lower 27% to UK investors as the Yen continued to weaken against Sterling. Conversely UK investors benefited from the strength of the US Dollar over the year which represented almost half of the US equity return of 24%. Pacific and emerging markets returned 16% and 13% respectively whilst even Europe which lagged behind the other markets returned a respectable 9% for the year.
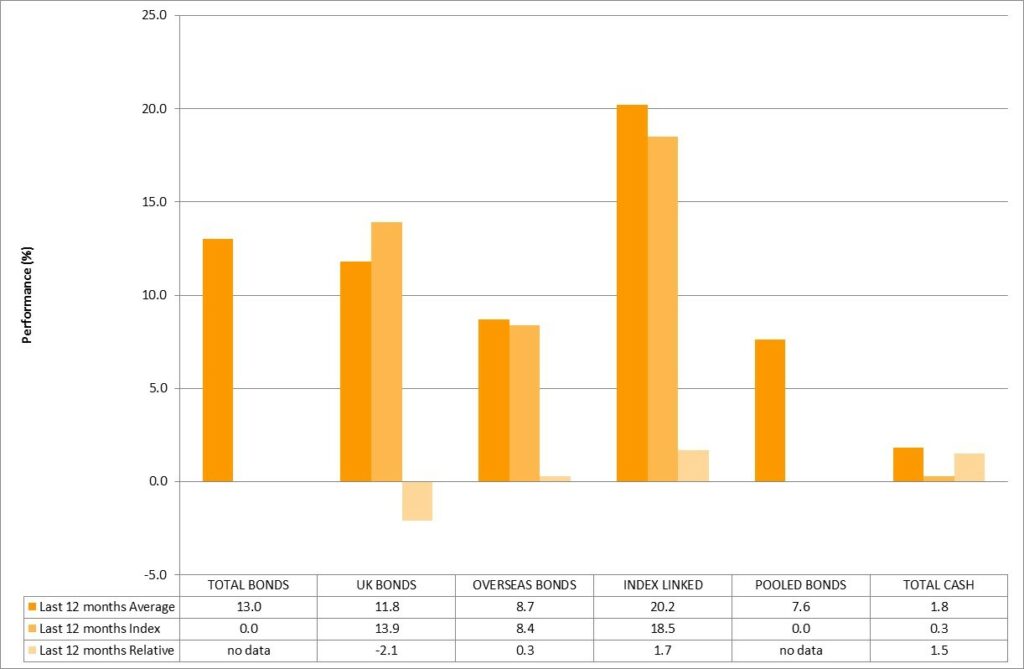
After the negative result in 2013/14, UK bonds bounced back strongly, producing a return of 12%. Duration was the big story of the latest year with massive differences in return depending upon where a fund was invested on the yield curve. Long-dated gilts produced returns approaching 30% as yields reached historic lows as investors who needed to hold them for liability matching purposes continued to buy them at any price. On the other hand, short-dated bonds returned only 3% for the year. The index–linked story for the year was much the same; funds returning 20% on average with the return driven by longer dated issues.
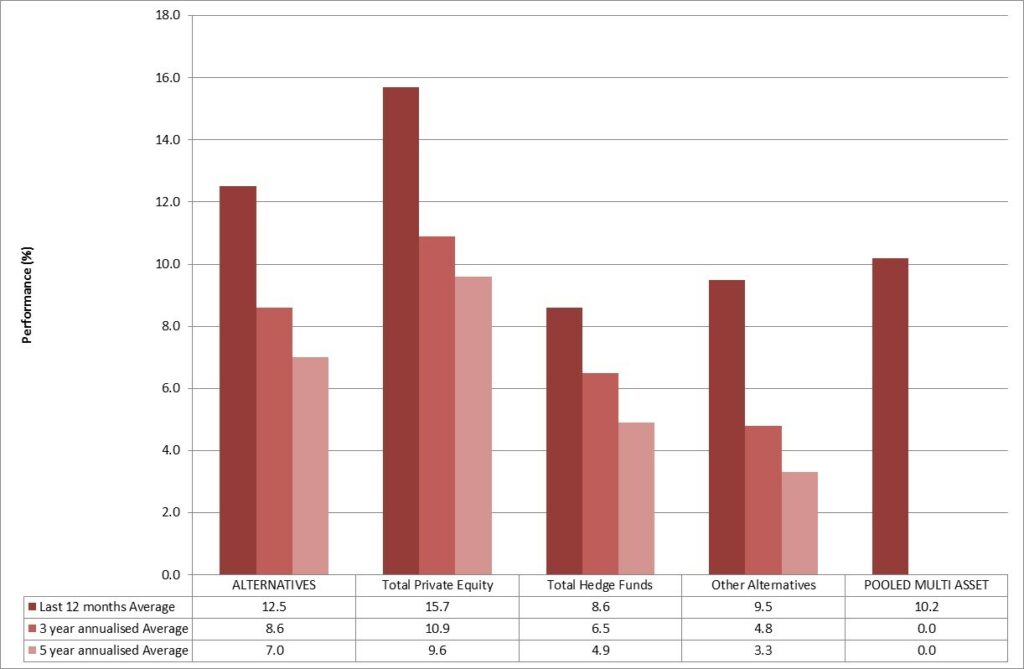
Alternative investments had a good year. Private equity returned 15% whilst hedge funds averaged 9%. Pooled multi asset (diversified growth) investments returned a strong 10%, well ahead of most funds’ targets for this asset class. Property returned 16% for the year.
Although the bulk of local authority funds continue to be cash flow positive almost a quarter saw a net outflow over the last twelve months. The net investment into the Universe as a whole was broadly in line with the previous year at £2.4 billion. This represented less than the level of income generated over the period of £2.9 billion. We expect to see more funds moving from positive to negative cash flow in the relatively near term. This will create new challenges in terms of setting strategy and is ultimately likely to result in a more conservative asset allocation as funds worry about being forced sellers of volatile asset types such as equities. To date most funds are continuing with their relatively high equity commitment and we have not seen a widespread ‘derisking’ or move into liability matching investments in the same way that we have seen across corporate funds.
Longer Term
Despite the many challenges of the last 20 years, the average fund has achieved a return of 8% pa. This was 5% pa above inflation and well ahead of actuarial return assumptions.
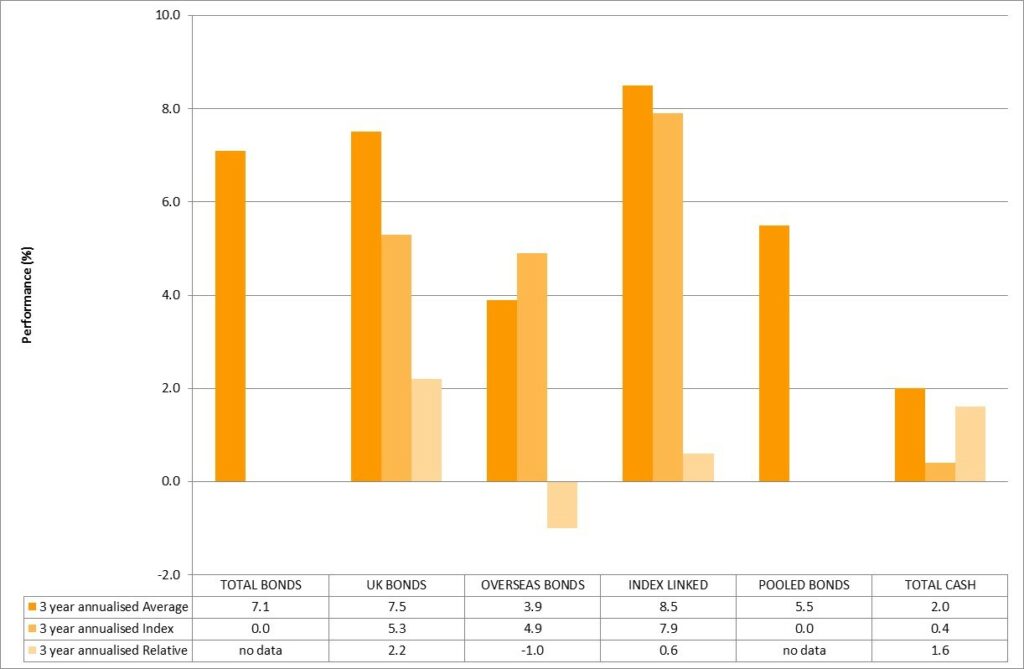
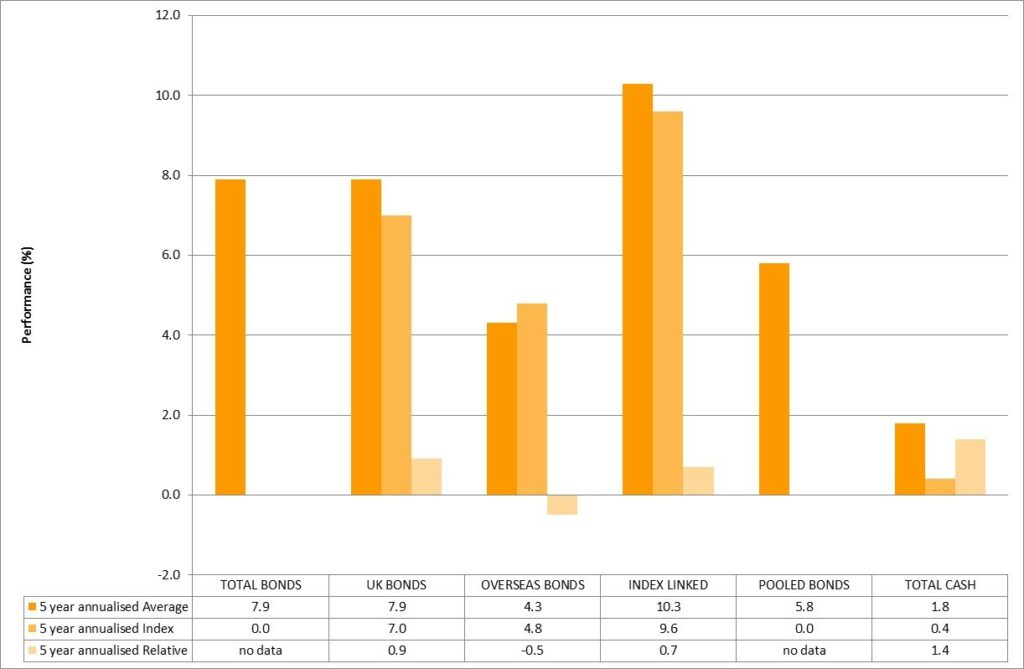
Over the shorter term performance has been even stronger. Over the last five years funds have returned 9% pa: 6% pa above inflation and over the last three years the 11% pa achieved represents a 9% pa real return.
The following report for 2014 has been provided by State Street Investment Analytics (SSIA).
Investment Performance and Asset Allocation Relative to Corporates
This summary is based on 85 LGPS funds with a total Market Value of £200bn. The corporate pension fund universe based on 98 Funds (covering 60% of UK corporate funds) with a total market value of £346bn. Over the last 3 years the investment performance of LGPS pension funds is 0.3% less than corporate pension funds, however over 5 and 10 years the investment performance of LGPS funds exceeds that of corporate pension funds by +0.9% and +0.1%.
| Relative Asset Allocation % | Equity | Fixed Income | Cash | Alternatives | Pooled Multi-Asset | Currency Instruments | Property |
|---|---|---|---|---|---|---|---|
| LA End March 2014 █ | 63.2 | 16.4 | 2.9 | 7.0 | 3.1 | 0.0 | 7.4 |
| LA End March 2015 █ | 61.5 | 17.1 | 2.7 | 7.9 | 2.8 | 0.0 | 8.0 |
| Corporate End March 2013 | 35.2 | 44.6 | 3.0 | 9.6 | 0.3 | 0.6 | 6.7 |
| Corporate End March 2014 | 34.5 | 46.8 | 2.6 | 9.2 | 0.3 | 0.0 | 6.5 |
| Impact | -0.6 | -0.7 | – | – | -0.1 | 0.3 | – |
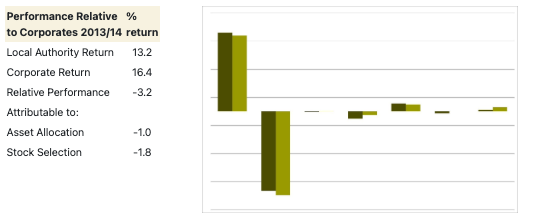
Longer-Term Peformance Relative to Corporates
| % p.a. to End March | 2005 | 2006 | 2007 | 2008 | 2009 | 2010 | 2011 | 2012 | 2013 | 2014 | 2015 |
|---|---|---|---|---|---|---|---|---|---|---|---|
| Local Authority | 11.7 | 24.9 | 7.0 | -2.8 | -19.9 | 35.2 | 8.2 | 2.6 | 13.8 | 6.4 | 13.2 |
| Corporate Funds | 11.7 | 24.0 | 7.0 | -0.4 | -17.5 | 28.4 | 8.0 | 7.2 | 12.8 | 3.7 | 16.4 |
| Relative | 0.5 | 0.7 | 0.0 | -2.4 | -2.9 | 5.3 | 0.2 | -4.3 | 0.9 | 2.6 | -2.8 |
| % p.a. | 3 Yrs | 5 Yrs | 10 Yrs | 20 Yrs |
|---|---|---|---|---|
| Local Authority | 11.0 | 8.7 | 7.9 | 7.8 |
| Corporate Funds | 10.8 | 9.5 | 8.2 | 7.9 |
| Relative | 0.2 | -0.7 | -0.3 | -0.1 |
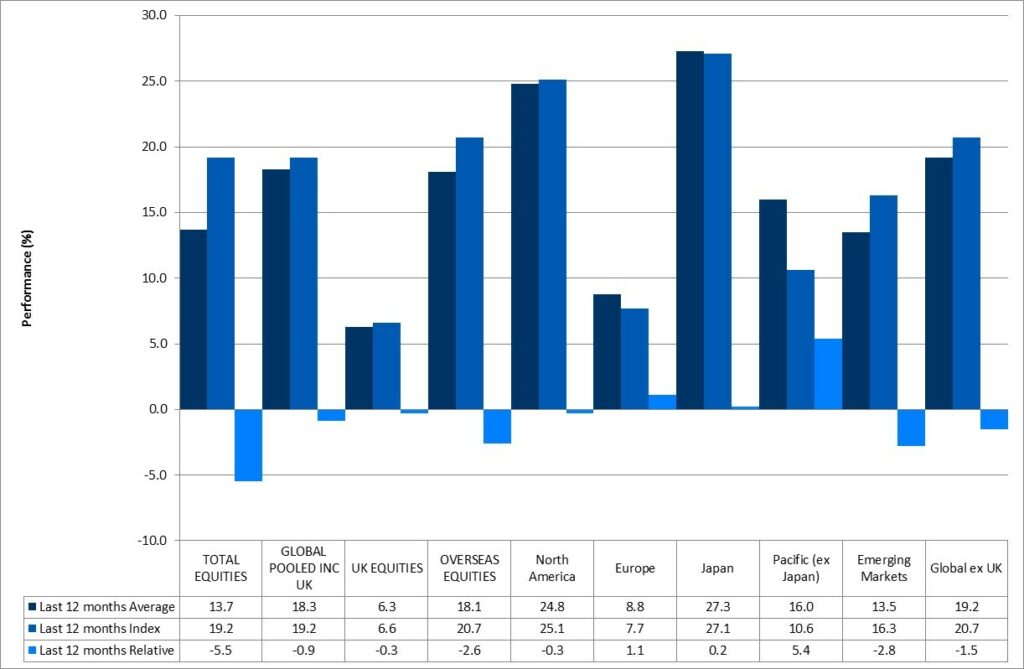
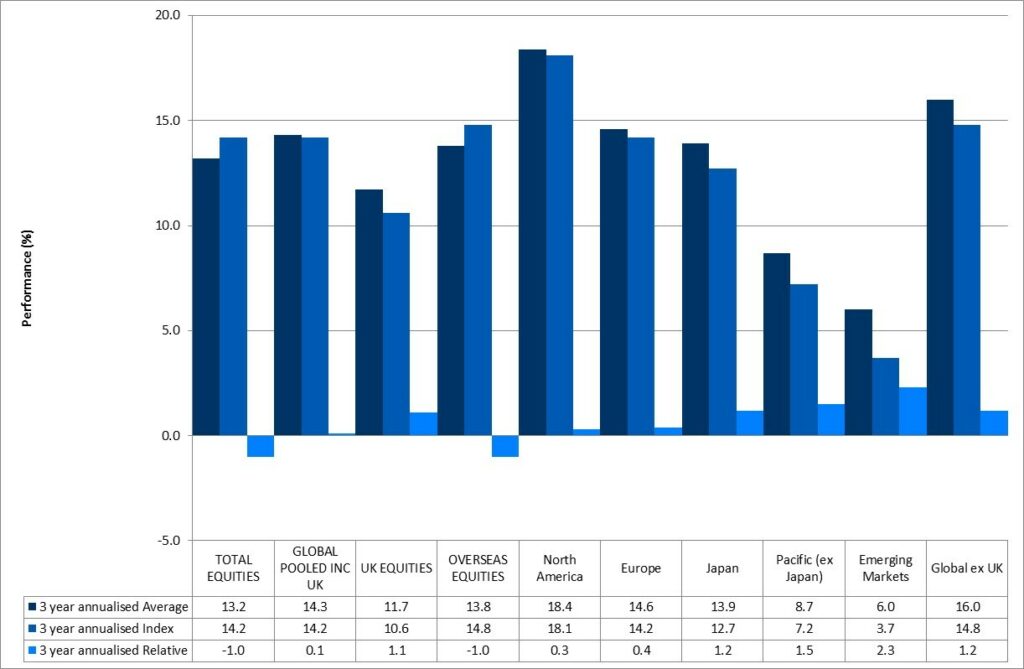
Local Authority Universe 2015
The charts below are based on SSIA’s Local Authority Universe 2015. Note that the following summary is based on 85 funds with a total Market Value of £199,896m. The funds not included on this list are; Berkshire, Cheshire, City of Westminster, Durham, Hammersmith and Fulham, Hampshire, Hertfordshire, Kensington and Chelsea, Lambeth, London Pensions Fund Authority, Shropshire, Staffordshire and Tyne and Wear.
Equity performance to year ended 31 March 2015
Equity performance three years annualised to 31 March 2015

Equity performance five years annualised to 31 March 2015
Bond performance to year ended 31 March 2015
Bond Performance three years annualised to 31 March 2015
Bond Performance five years annualised to 31 March 2015
Alternatives performance for periods ended 31 March 2015
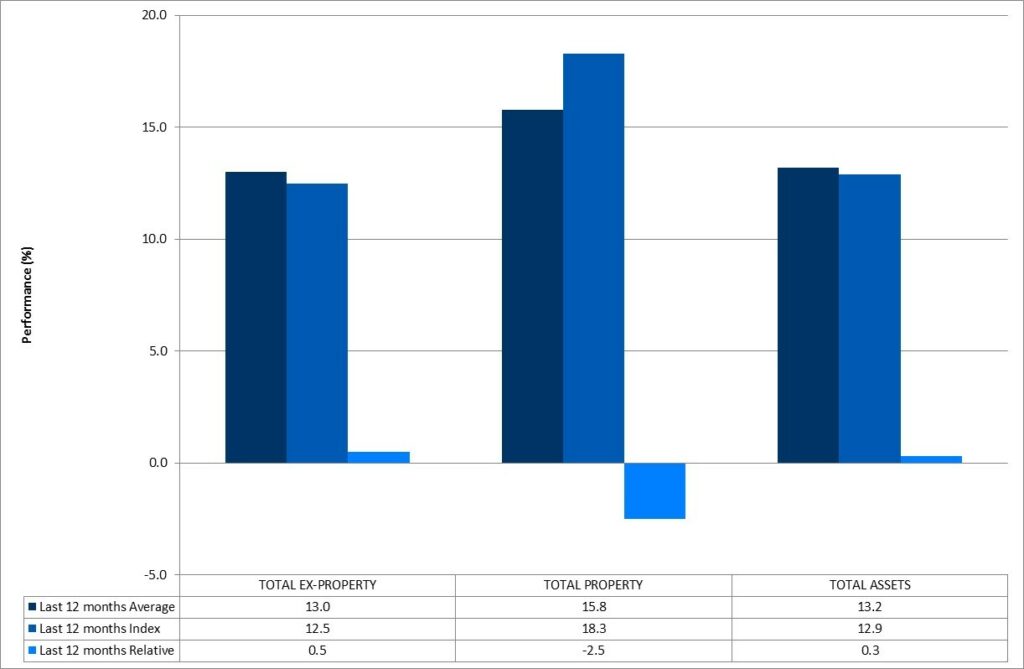
Total Assets Performance to year ended 31 March 2015
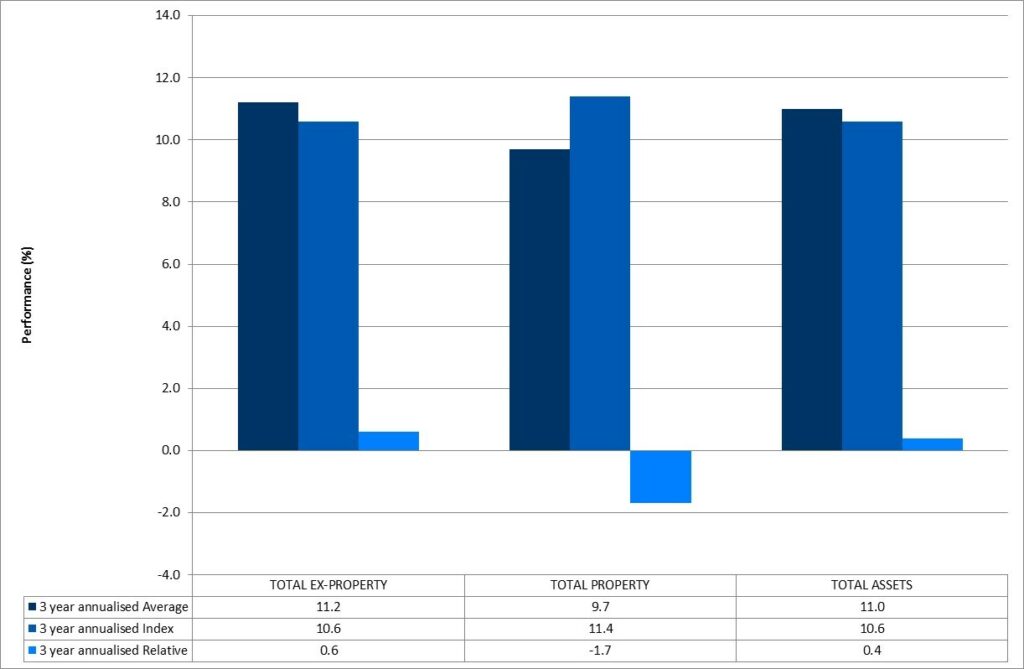
Total Assets Performance three years annualised to 31 March 2015
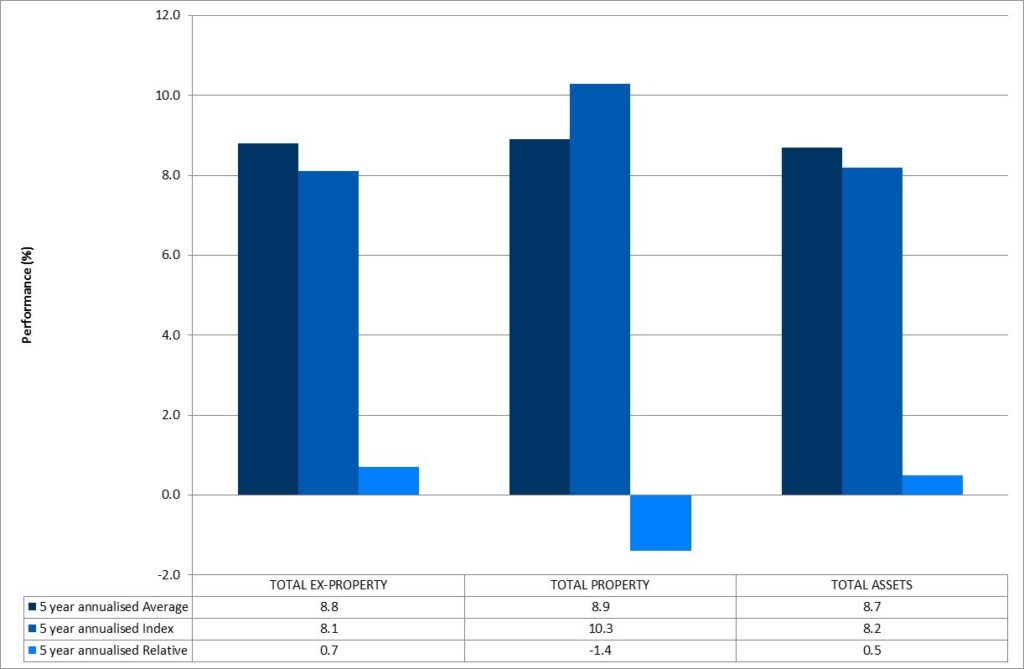
Total Assets Performance five years annualised to 31 March 2015
Report pages
Was this page helpful?