Investment
Asset management and stewardship
Stewardship and responsible investment
Collectively the £263bn LGPS funds are one of the largest 10 global sources of capital and can influence behavioural changes that lead to better stewardship by the global asset management community and the entities and places they invest in.
All LGPS funds have published their Investment Strategy Statement (replacing Statement of Investment Principles) and comply with the Myners Principles as these are LGPS statutory requirements.
The UK Stewardship Code (second edition 2012) and global United Nations Principles of Responsible Investment (UNPRI) set out key principles of effective stewardship for asset owners to help them better to exercise their stewardship responsibilities.
Compliance with these UK and global sets of principles is not mandatory for LGPS funds but they have the support of the UK Government and Local Authority Pension Fund Forum (LAPFF).
As at 31st March 2017 some 28 (31%) were signatories to the Code and 8 funds (8%) (plus one pool company becoming a signatory in March 2018) are signatories to the UNPRI (see table below).
Signatory to UNPRI
Source: https://www.unpri.org/directory/
| Account Name | Signatory Category | HQ Country | Signature Date |
| Brunel Pension Partnership (BPP) | Investment Manager | United Kingdom | 16/03/2018 |
| Kent County Council Superannuation Fund | Asset Owner | United Kingdom | 11/04/2016 |
| Lancashire County Pension Fund | Asset Owner | United Kingdom | 10/03/2015 |
| Greater Manchester Pension Fund | Asset Owner | United Kingdom | 06/05/2014 |
| West Midlands Pension Fund | Asset Owner | United Kingdom | 28/06/2011 |
| Merseyside Pension Fund | Asset Owner | United Kingdom | 10/10/2007 |
| London Pensions Fund Authority (LPFA) | Asset Owner | United Kingdom | 16/07/2007 |
| Environment Agency Pension Fund | Asset Owner | United Kingdom | 14/07/2006 |
Signatories to UK Stewardship Code
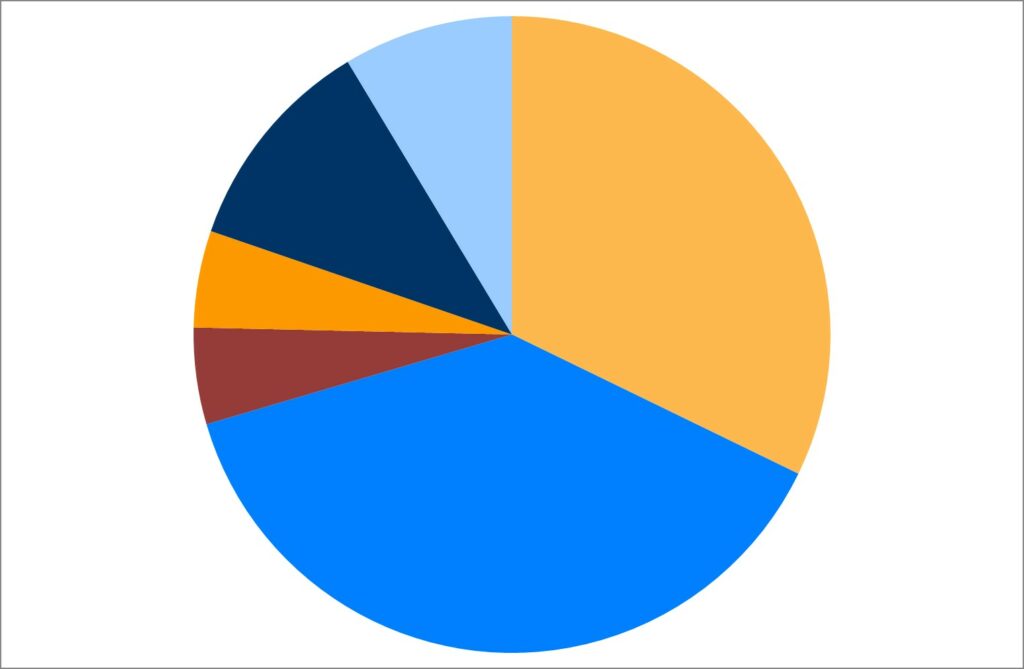
Investment allocation
Change in allocation chart based on aggregated Net Asset Statements year to 31 March 2017
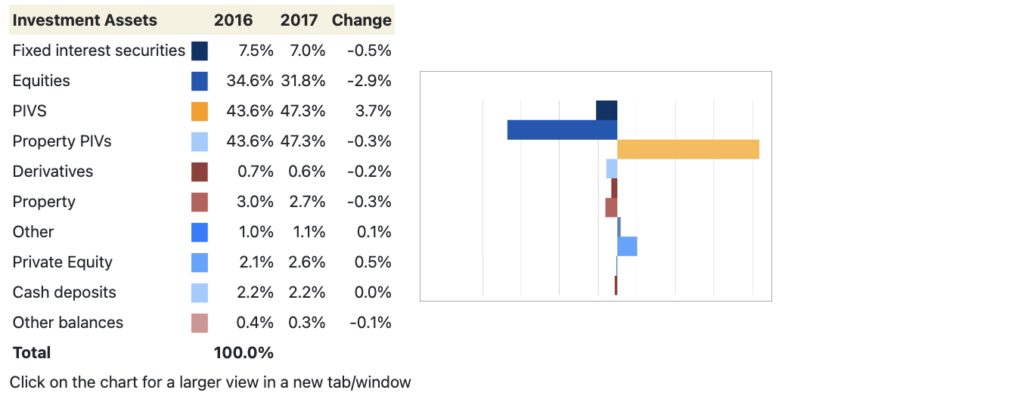
Asset allocation charts based on aggregated Net Asset Statements as at 31 March 2017
| Asset class | Asset type | £000s | % | £000s | % | |
|---|---|---|---|---|---|---|
| Bonds | Bonds | █ | 18,296,952 | 7.0% | 18,296,952 | 7.0% |
| Equities | Equities | █ | 83,562,772 | 31.8% | 83,562,772 | 31.8% |
| PIV | PIV | █ | 124,445,238 | 47.3% | 124,445,238 | 47.3% |
| Property PIV | Property | █ | 11,942,985 | 4.5% | 18,971,332 | 7.2% |
| Property direct | █ | 7,028,347 | 2.7% | |||
| Other | Other | █ | 17,881,572 | 6.8% | 17,881,572 | 6.8% |
| Total | 263,157,866 | 100.0% |
Total asset allocation
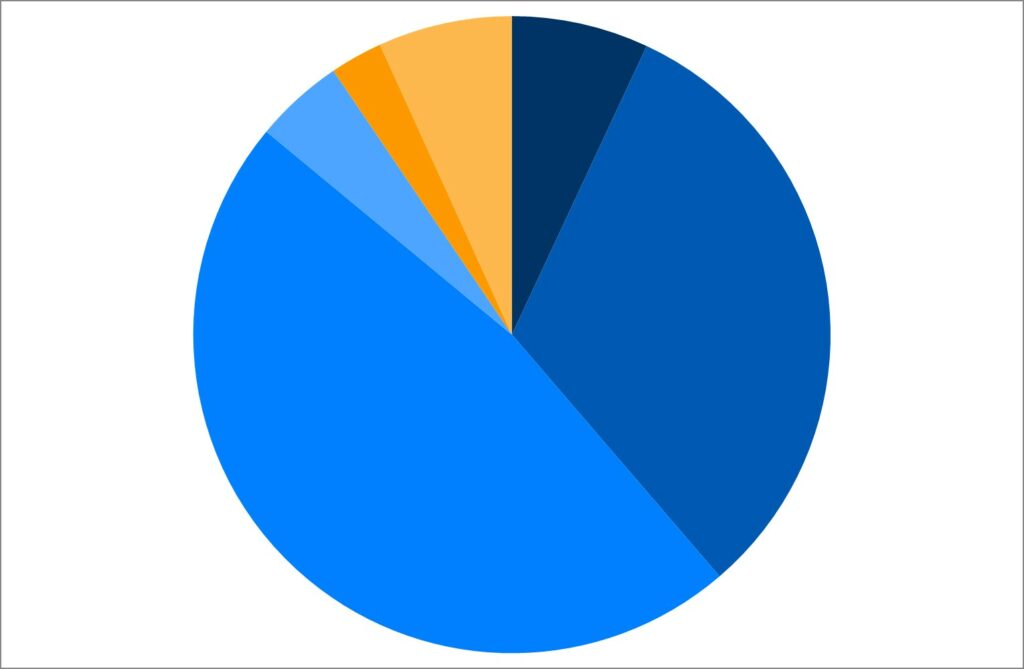
Total asset allocation
| Asset class | Asset type | £000s | % | |
|---|---|---|---|---|
| Other | Cash Deposits | █ | 5,758,734 | 32.2% |
| Private equity | █ | 6,838,655 | 38.2% | |
| Other balances | █ | 876,902 | 4.9% | |
| Other (including aggregated private equity/infrastructure/other) | █ | 878,722 | 4.9% | |
| Infrastructure | █ | 1,985,679 | 11.1% | |
| Derivatives | █ | 1,542,880 | 8.6% | |
| Total | 17,881,572 | 100.0% |
Net return on investment based on aggregated Fund accounts year to 31 March 2017
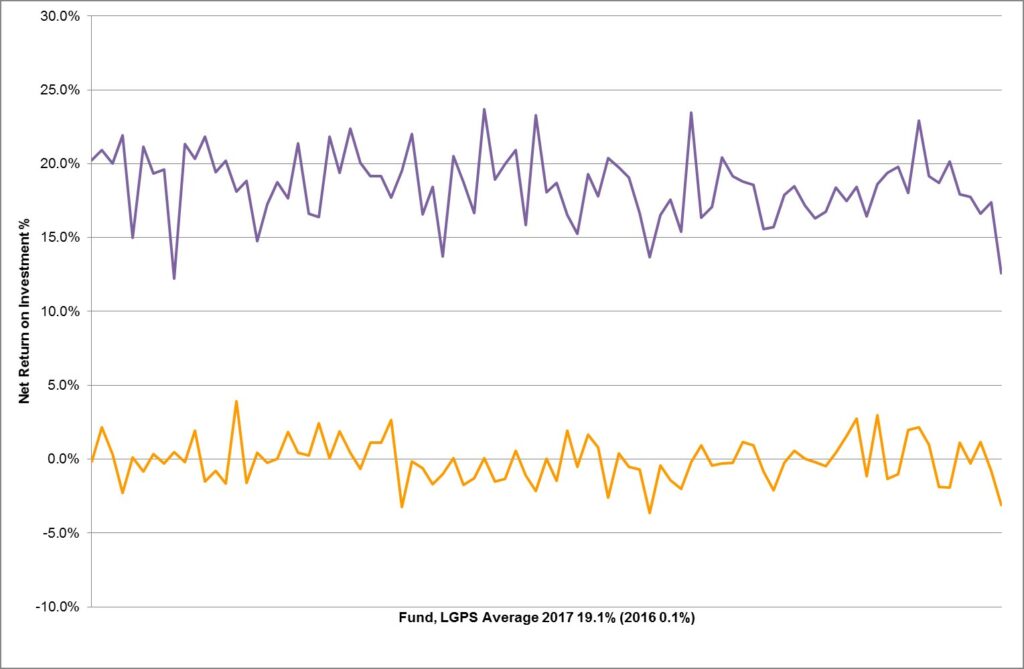
Net return on investment % is calculated by dividing the net return on investment by the average value of the fund over the year – this differs from calculated performance.
The average return on investment, and total for the scheme on an aggregate basis, for the year ended 31 March 2016 was 19.4% (2016 0.4%). The average investment expenses were 0.4% over the period (2016 0.4%), therefore the net return on investment was 19.0% (2016 0.1%).
The above chart shows the distribution around 19.0%, for 2016 █, with most funds falling in a range of between 15.0% and 22.0%. For 2016 █ the distribution was around 0.1%, with most funds falling in a range of between 0.3% and -0.3%.
Investment Performance
The following market commentary was provided by Pensions & Investment Research Consultants Ltd (PIRC) based on their Local Authority Pension Fund Performance Universe. Please see the LAPPA websitefor further details.
This year’s peer group results is based on a Universe of 60 funds with a value of £162bn. This represents some two thirds of local authority pension fund assets and includes all of the Welsh and Northern Pools, all bar three of the London Pool, with funds from all other pools except Central.
LA Market Environment
Over the last twelve months the average Local Authority pension fund has returned 21.4%. This return is well ahead of the 30 year average of 8.7% p.a. and well ahead of actuarial assumptions which are currently estimating around 5% p.a. Funds also had an unusually strong year compared to their own benchmarks – with more than three quarters outperforming. This is in contrast to the ten year results where the majority of funds underperformed their benchmarks after fees.
Local authority funds have retained a high commitment to equities which, this year has been extremely favourable.
UK equities performed well despite the large fall in the value of Sterling. Whilst initially counterintuitive, this reflects the importance of large overseas earnings of many of the UK quoted companies. The UK returned 21.4% for the year with large companies, as represented by the FTSE 100, outperforming their smaller peers (within the FTSE 250 and Small Cap indices) for the first time in eight years.
Overseas returns were better still, boosted for those funds who did not hedge their assets, by the marked decline in Sterling following the surprise decision to leave the EU. Local authority funds saw returns of around 35% across their US, Japanese and Pacific Rim investments with a marginally lower 33% from Emerging Markets and 27% from Europe. Most funds invest on an unhedged basis –funds that were fully hedged would have produced returns around 15% lower on their overseas assets. Despite the increased political instability and resulting volatility, bond markets produced positive results. Funds achieved an average return from UK government bonds of 10.1% with corporates rather better at 11.7%. Index Linked gilts returned 18.2%. Alternative investments as usual had a mixed time and there was a very wide dispersion of returns across this group. The average fund produced a return of 16.0% from this grouping. Private equity investments delivered close to 20% for the year, Infrastructure almost 18% whilst hedge funds returned 10%.
Diversified Growth funds, with an average return of 7.2%, outperformed their benchmarks but produced returns well below most other investments. Property produced a return of 6.2%. How to appropriately benchmark these investments has long been a source of contention. Some funds benchmark these against relatively soft targets such as cash or inflation whilst others are benchmarking against more demanding (and arguably better aligned targets) such as cash plus 4% p.a. or absolute return targets such as 8% p.a. In the latest year, regardless of which approach was taken, most funds outperformed their benchmark for alternative assets. This outperformance was the key driver in the unusual statistic that more than three-quarters of funds managed to outperform their benchmark in the latest year .
If we exclude the transport funds, which have very different liability profiles, the range of results in the latest year ranged from a high of 26.8% to a low of 13.9%. Generally funds with a higher equity component were towards the top of the range with those that had a higher commitment to absolute return strategies towards the bottom. Many active equity managers struggled to add value in the peculiar market conditions with the majority of global equity managers employed across the LGPS underperforming, and some quite significantly. Managers who had a value type approach to investing – where there is a greater focus on dividends, tended to perform better.
Local authority funds still retain a high commitment to active management with the average fund having just under a quarter of its assets managed passively. Whilst the weighting in passive has been increasing it has been doing so very slowly – ten years ago the average fund’s passive exposure was already 20%. The increased focus on cost reduction may promote a further move towards index-tracking, however this may be balanced by the asset allocation decisions being made, with funds continuing to increase exposure to assets for which there is no passive alternative.
The median (middle) performing fund returned 20.6%, 0.8% below the average. This reflects the relatively strong performance of the larger funds in the Universe this year. These funds have benefited from a relatively high exposure to equities and better returns within this area.
In terms of asset allocation, there was no significant change at the macro level over the year. The relatively small changes observed resulted from differential market movements rather than cash flow, with equities increasing in proportion as a result of the strong results achieved over the year and property reducing because of the relatively poor results. At 62% of the average fund, equities represent the largest component by a significant amount as can be seen in Figure 2 below.
| % Allocation | 31/3/2016 | 31/3/2017 |
|---|---|---|
| Equities | 60 | 62 |
| Bonds | 16 | 15 |
| Alternatives | 9 | 10 |
| Property | 9 | 8 |
| Cash | 3 | 2 |
| Diversified Growth | 3 | 3 |
There were a number of portfolio changes: Some on the back of disappointing performance, some structural, and others as a result of funds, particularly in London where asset pooling is further advanced, aligning their managers to take advantage of the new pool structures.
Longer Term Performance
Longer term performance has been strong. There have been only six years of negative performance in the last thirty – following the crash of 1987, at the start of the millennium (the bursting of the dot-com bubble) and the global financial crisis of 2008/9. The thirty year return of 8.6% p.a. demonstrates the strength of investment returns over the period and highlights again that it is the increase in the value of liabilities rather than any failing on the asset side that has caused the issues that funds are now grappling with. Figure 3 shows that over the three years the average fund returned 11.2% p.a. and over the ten years (which includes the period of the global financial crisis) has returned 7.0% p.a. These results are particularly impressive when viewed in the context of very low single digit inflation. The median result is below the average over all periods indicating the relatively strong performance of larger funds in aggregate over their smaller peers. This result does not reflect the range of results across the smaller funds, a group within which there is a marked dispersion. Indeed over all periods the very best performances have come from some of the smallest funds.
Figure 3: Discrete Period Performance of Local Authority Funds
| % pa | 3 Years | 5 Years | 10 Years | 20 Years | 30 Years |
|---|---|---|---|---|---|
| Average | 11.2 | 10.7 | 7.0 | 7.4 | 8.6 |
| Median | 10.8 | 10.7 | 6.8 | 7.1 | – |
| RPI | 1.9 | 2.3 | 2.8 | 2.8 | 3.3 |
| CPI | 0.9 | 1.4 | 2.3 | 2.0 | 2.6 |
Report pages
Was this page helpful?