Investment
Asset management and stewardship
Stewardship and responsible investment
Collectively the £276bn LGPS funds are one of the largest 10 global sources of capital and can influence behavioural changes that lead to better stewardship by the global asset management community and the entities and places they invest in.
All LGPS funds have published their Investment Strategy Statement (replacing Statement of Investment Principles) and comply with the Myners Principles as these are LGPS statutory requirements.
The UK Stewardship Code (second edition 2012) and global United Nations Principles of Responsible Investment (UNPRI) set out key principles of effective stewardship for asset owners to help them better to exercise their stewardship responsibilities.
Compliance with these UK and global sets of principles is not mandatory for LGPS funds but they have the support of the UK Government and Local Authority Pension Fund Forum (LAPFF).
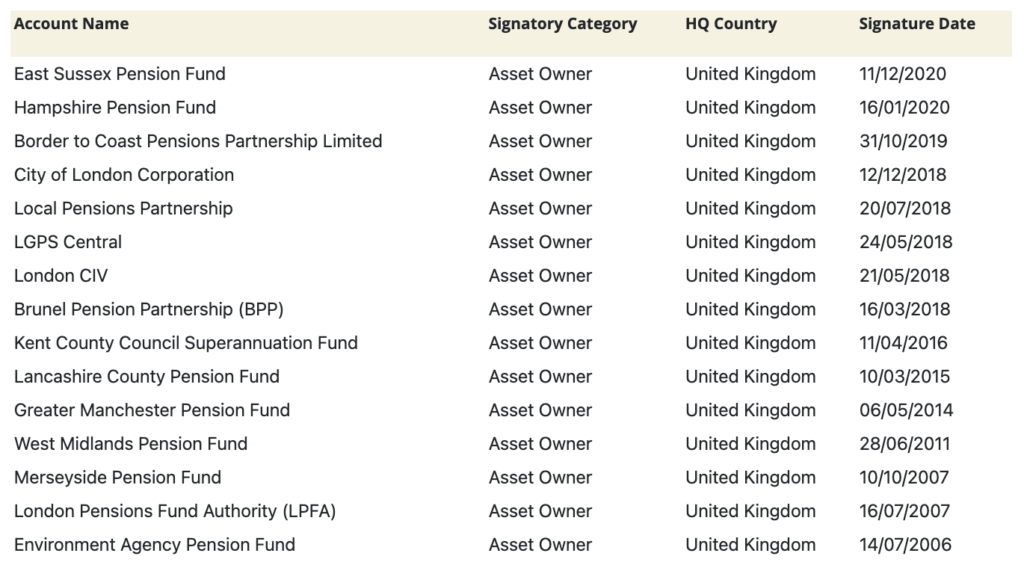
Some 32 LGPS funds/pools (36%) were Tier 1 signatories to the Code and 12 funds (13%) (inc five pool companies) were signatories to the UNPRI (see table below). Since March 2020, East Sussex Pension Fund became a signatory to UNPRI.
Signatory to UNPRI
Source: https://www.unpri.org/directory/
Signatories to UK Stewardship Code
Tier 1
Tier 2
| Signatories meet many of the reporting expectations but report less transparently on their approach to stewardship or do not provide explanations where they depart from provisions of the Code. |
| Gwynedd Pension Fund |
| London Borough of Bexley Pension Fund |
| London Borough of Ealing Pension Fund |
| London Borough of Hillingdon Pension Fund |
| London Borough of Waltham Forest Pension Fund |
| Merseyside Pension Fund |
| Rhondda Cynon Taff Pension Fund |
| Somerset County Council |
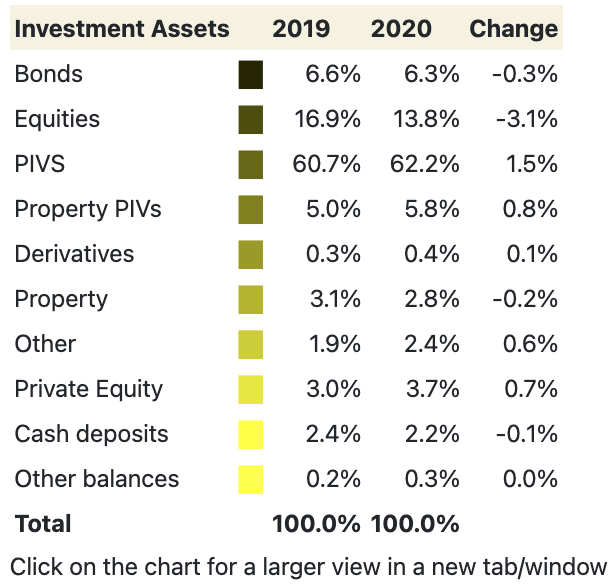
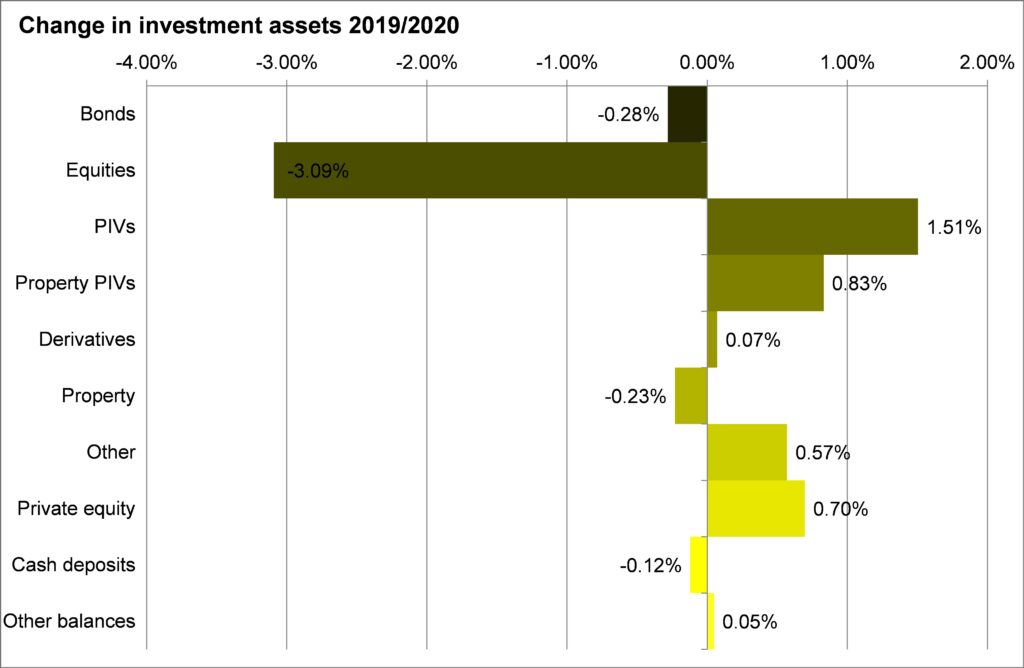
Investment allocation
Change in allocation chart based on aggregated Net Asset Statements year to 31 March 2020
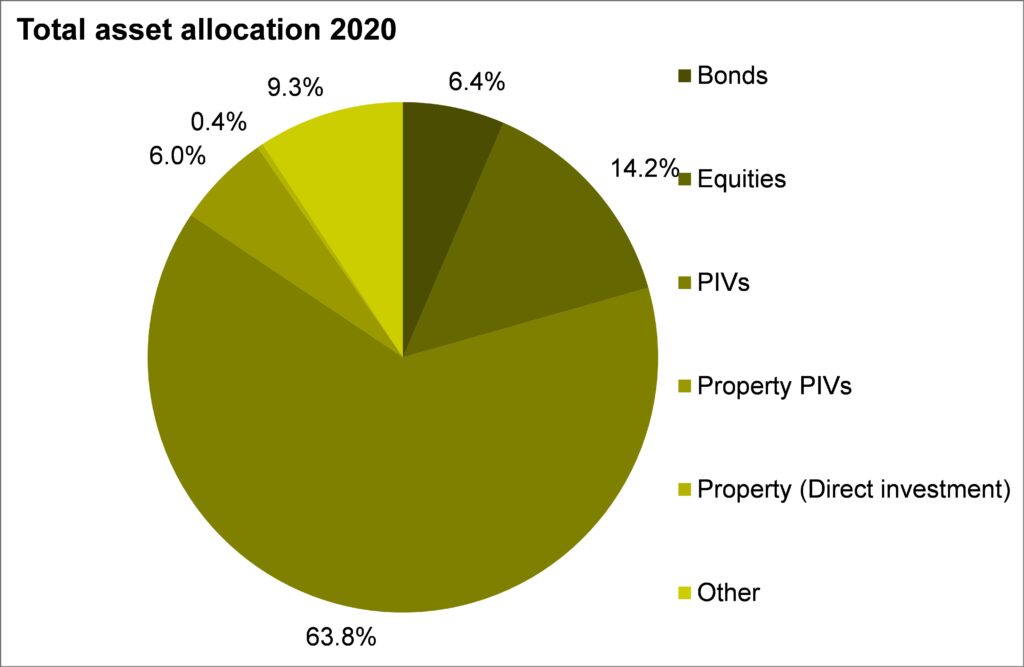
Total asset allocation
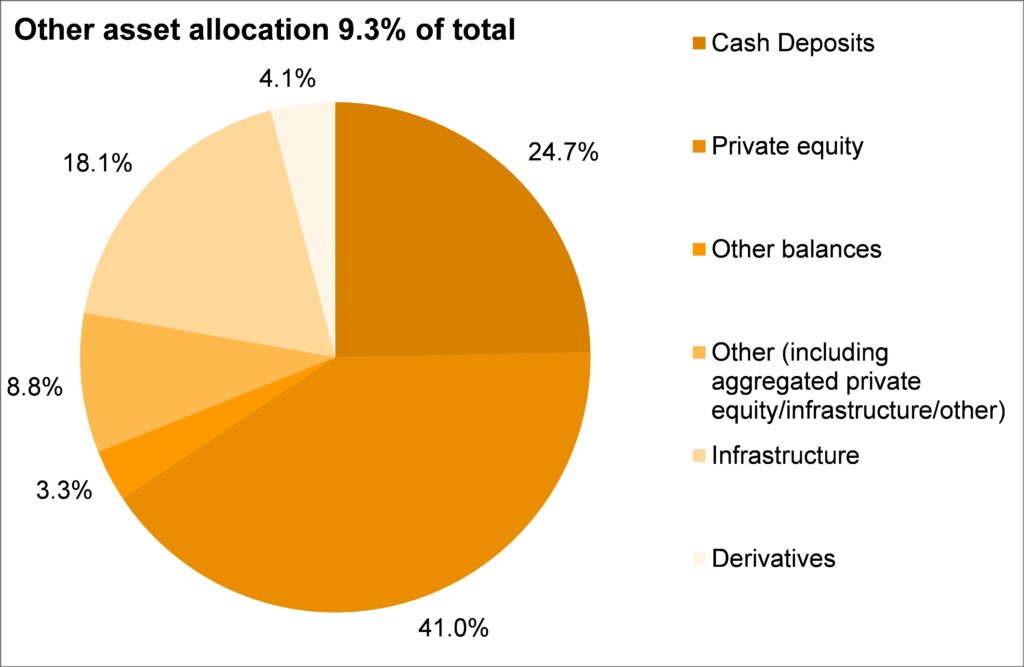
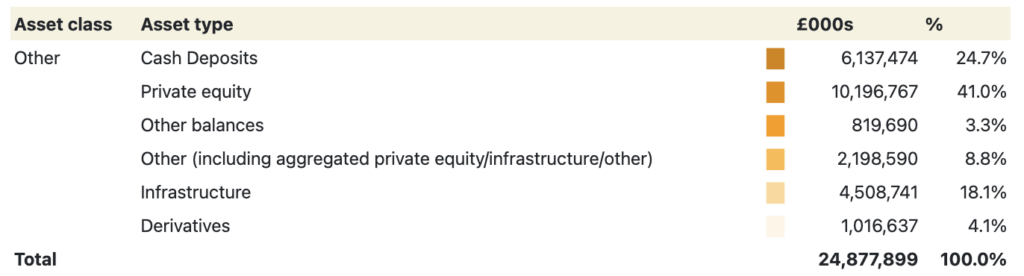
Other asset allocation
Net return on investment based on aggregated Fund accounts year to 31 March 2020
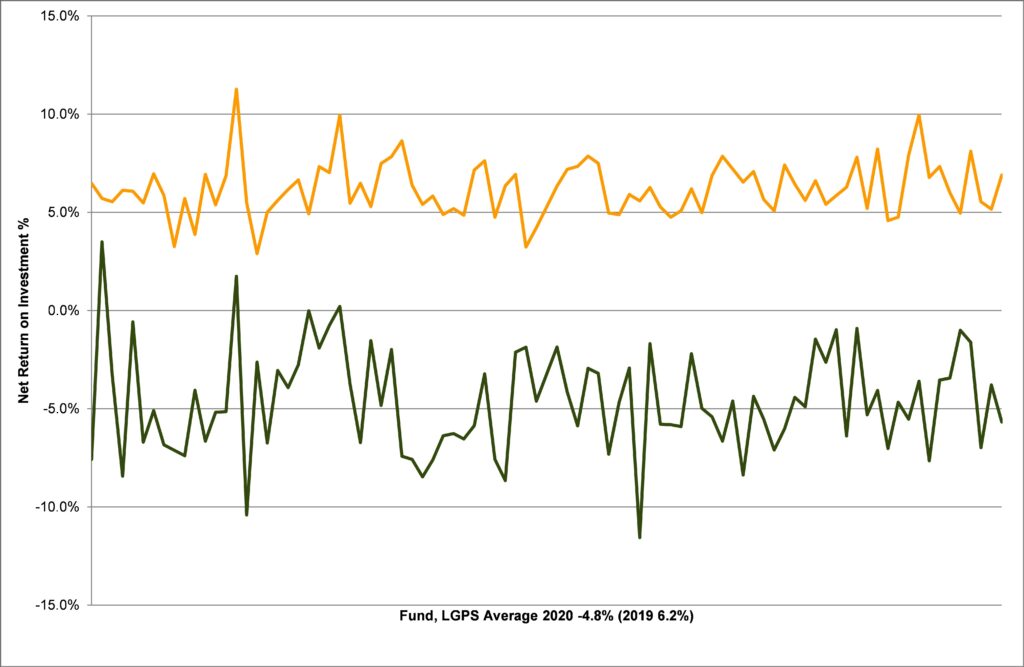
Net return on investment % is calculated by dividing the net return on investment by the average value of the fund over the year – this differs from calculated performance.
The average return on investment, and total for the scheme on an aggregate basis, for the year ended 31 March 2020 was -4.4% (2019 6.6%). The average investment expenses were 0.5% over the period (2019 0.4%), therefore the net return on investment was -4.8% (2019 6.2%).
The above chart shows the distribution around 6.0%, for 2020 █, with most funds falling in a range of between 4.0% and 8.0%. For 2018 █ the distribution was around 4.0%, with most funds falling in a range of between 2.0% and 6.0%.
Investment Performance
The following market commentary was provided by Pensions & Investment Research Consultants Ltd (PIRC) based on their Local Authority Pension Fund Performance Universe.
This year’s peer group results is based on a Universe of 63 funds with a value of £180bn. This represents some two thirds of local authority pension fund assets and includes all of the Welsh and Northern Pools, all bar one of the London Pool, with funds from all other pools except Central.
LA Market Environment
Unlike previous market crashes no one could have predicted the events that brought the world to a virtual standstill at the start of 2020. The first quarter of 2020 saw global equity markets lose a quarter of their value while credit markets also fell, property funds were closed as managers struggled to determine how to value assets in these new times.
But the results for the year were not as bad as might have been expected from the gloomy position we found ourselves in at the end of March. Equities had fallen, but from historic highs and funds, now more diversified than ever saw their total assets fall, but only by an average of 4.8%.
Those funds that had more of their money invested in alternative strategies, particularly private equity, performed better than their peers who had high quoted equity exposures. Some funds had put in place insurance against market falls and those funds reaped the benefit last year. However not all strategies that were intended to be low risk delivered – alternative bond strategies failed to deliver positive results as did Diversified Growth investments.
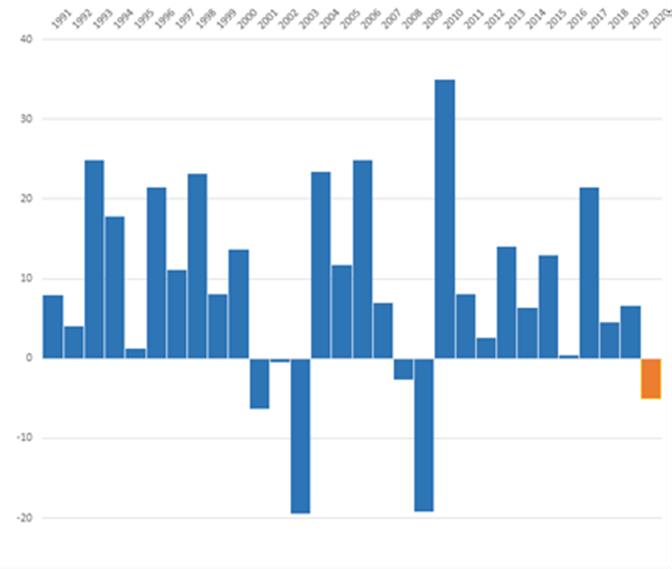
The scale of this year’s dislocation has been much lower than seen in 2003 or 2008 and, whilst the annual result is impacting the short term performance, over the medium term fund returns remain strong and significantly ahead of inflation. Over the five years the return is above 5% p.a. and over ten years 7% p.a.
Longer term performance is better still. The thirty year return of just under 8% p.a, is 5.5% p.a above CPI for the same period.
Equities are no longer well ahead of other asset classes in terms of the long term returns that have been delivered but they make up a much smaller proportion of the average fund now than they did 30 years ago.
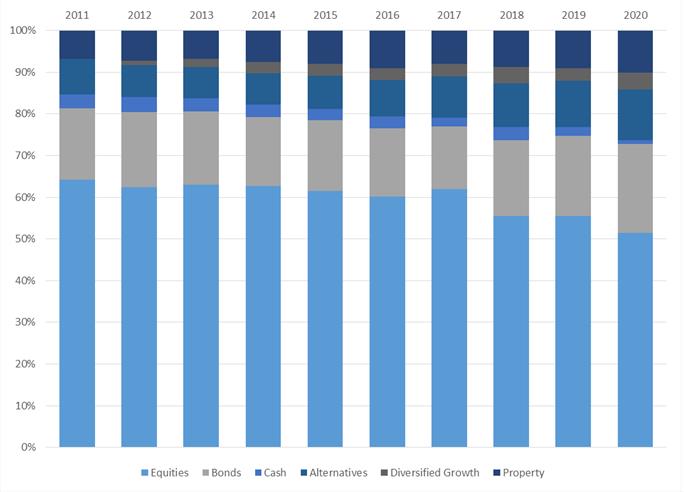
Funds have become increasingly diversified which has brought with it challenges of its own. Pooling should assist. Funds will need to ensure that they focus on best value not just low cost.
Report pages
Was this page helpful?